After breaking down from a long-term structure, bitcoin (BTC) has managed to bounce at the $28,700 Fib support area.
BTC has been trading inside a long-term ascending parallel channel since April 2021. The resistance line of this channel was most recently touched in Nov 2021, when the price reached a new all-time high of $69,000. BTC has been falling since.
Since April 2021, the support line of the channel had been validated three times (green icons), most recently in Jan. At the beginning of May, the price finally broke down from the channel. Afterward, it proceeded to reach a low of $26,700 on May 12, which was made just above the 0.618 Fib retracement support level.
The breakdown from such a long-term pattern indicates a break in structure and likely means that a significant downward movement has now begun.
Additionally, the RSI is bearish, after it was rejected by the 50 line (red circle). Readings below 50 are considered bearish, and the rejection indicates that the weekly trend is in turn bearish.
If the downward movement continues, the next closest support area would be at the 0.786 Fib retracement support level at $17,800.
Similarities to previous movements
An interesting development is that the weekly RSI has fallen below 50, and that there have been seven successive bearish weekly candlestick closes. In bitcoin’s price history, there have never been seven successive bearish candlestick closes.
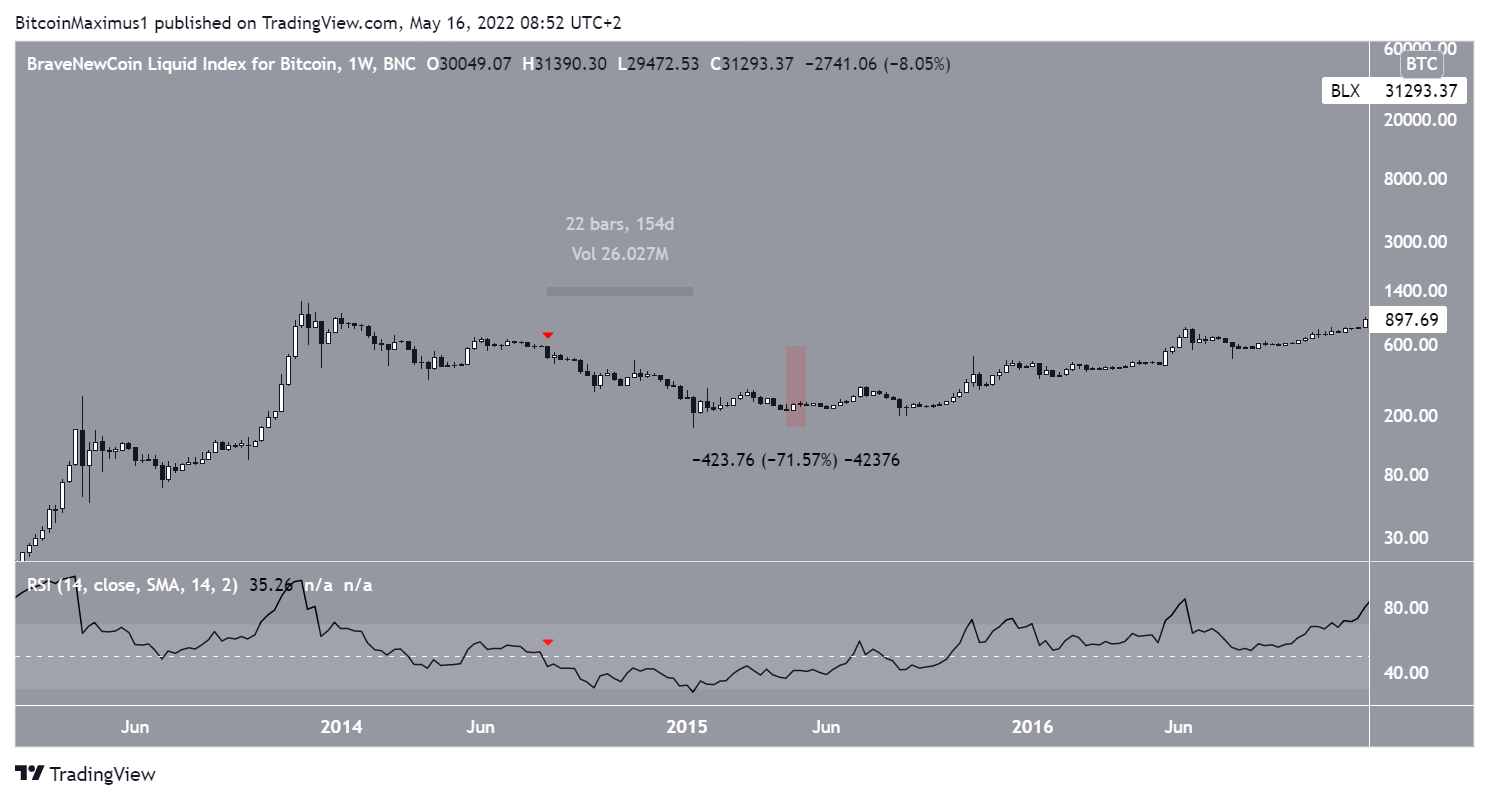
The first time that the RSI fell below 50 after a prolonged period above it was in Aug 2014 (red icon). Subsequently, it continued to decrease for a period of 154 days. During this time, it fell by 72%.

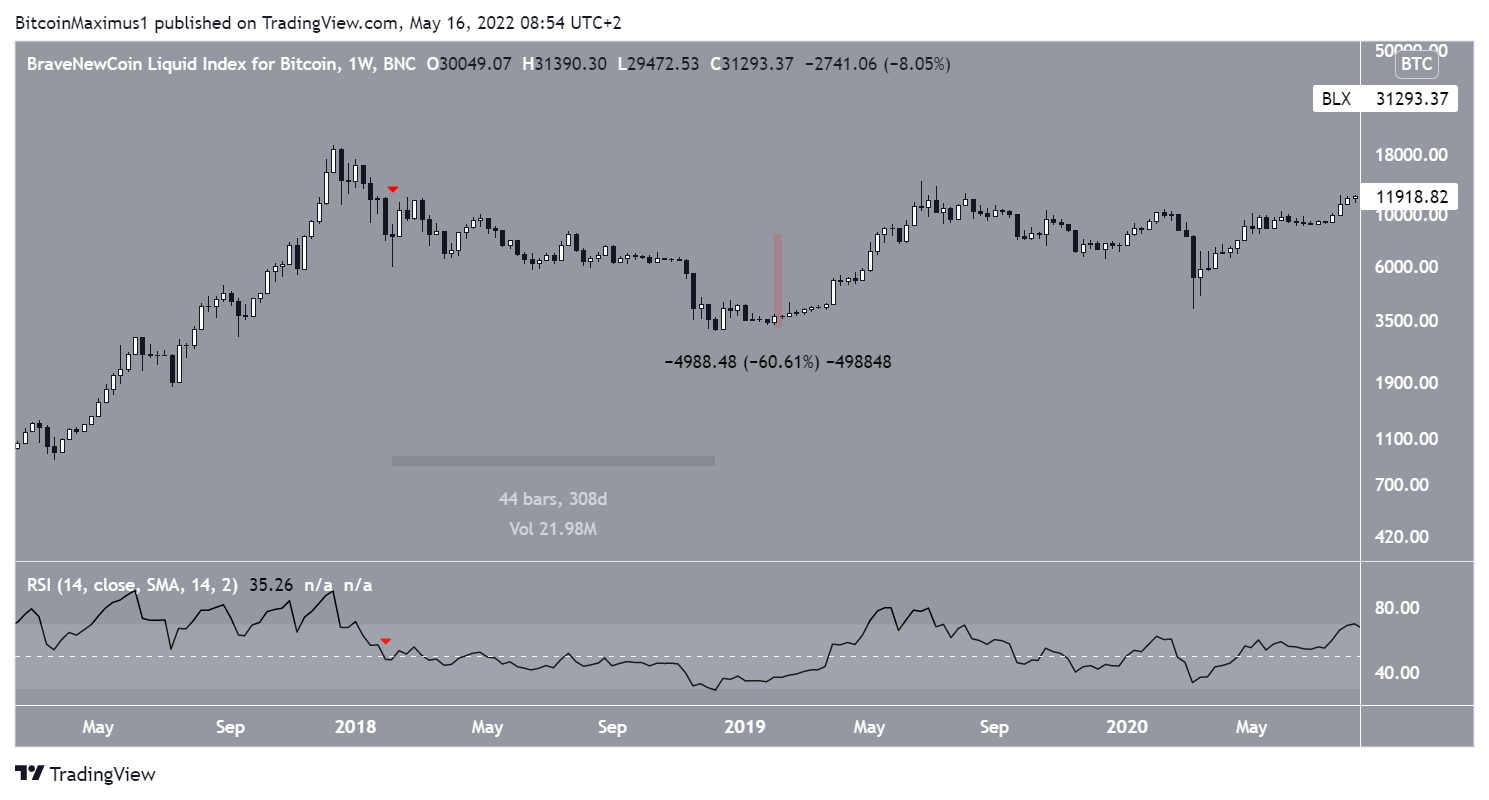
The second and final time this occurred was in Feb 2018. This breakdown was followed by a 308-day downward movement, in which Bitcoin fell by 60%.
During both these breakdowns, the price bottom was reached when the RSI was oversold.

For Be[in]Crypto’s previous Bitcoin (BTC) analysis, click here
Disclaimer
All the information contained on our website is published in good faith and for general information purposes only. Any action the reader takes upon the information found on our website is strictly at their own risk.


Be the first to comment