The crypto market, led by Bitcoin (BTC), remains vulnerable to a further short-term downside given the losses seen over the past 24 hours. This outlook is likely to thwart any immediate recovery plans for Ethereum, IOTA, and Vechain.
Vechain price analysis
The VET/USD pair has slipped by 4% over the last 24 hours, and by 22% this week.
As of writing, VET/USD is trading at $0.178, below both the 200 SMA and 100 SMA on the 4-hour chart. The cryptocurrency is also capped by a bearish trend line while the RSI is below 50, suggesting bears are in charge. If sellers breach support at $0.17, VET could retrace towards $0.15.
VET/USD 4-hour price chart. Source: TradingView
Although the price of VET has suffered major losses in the past week, the overall outlook suggests an uptick is possible if bulls manage to keep the bears at bay near $0.17. The key price levels to watch on the upside would be at $0.20 and $0.21.
IOTA price analysis
IOTA’s price as of writing is $1.89, around 1.03% down on the day and 12.4% in the red over the last week. Bears currently cap the action near the 20-day EMA at $1.97, having dragged the MIOTA/USD pair below the 50 SMA and a bullish support line.
The RSI is inflecting downwards below the equilibrium point to add to the bearish outlook for the IOTA market. If the downward trajectory holds short term, IOTA might decline towards $1.60 and then $1.40.

IOTA/USD 4-hour chart. Source: TradingView
IOTA is a unique cryptocurrency and recent upgrades are set to make it better suited to enterprise adoption. This might be fundamental to its market going forward. In the short term, a break higher could take prices above $2.00, with targets at $2.20 and $2.40.
Ethereum price analysis
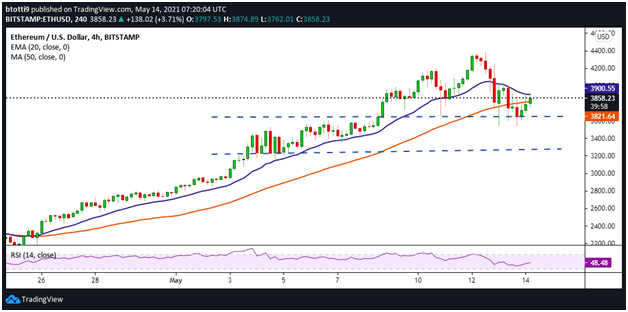
Ethereum’s retracement from a peak above $4,200 happened as BTC dipped below $50k on 12 May. While bears have managed to keep prices below $4k, the overall picture is positive for ETH/USD.
Notably, the ETH market is set for a $730 million options expiry on 14 May, a scenario likely to see further buying pressure for Ether. Bulls have pushed ETH’s price above the 50 SMA ($3,821) and could break resistance at the 20-day EMA ($3,901).

ETH/USD 4-hour chart. Source: TradingView
The RSI is looking to tip above 50, which could aid the bulls’ plans for a retest of the $4k level and possibly new highs near $4,500. Contrary to this, ETH/USD might drop to $3,650 and $3,260.


Be the first to comment