TRXUSD tries to overcome resistance seen at $0.07
A double bottom pattern formed at $0.05
An inverse head and shoulders pattern supports the bullish case
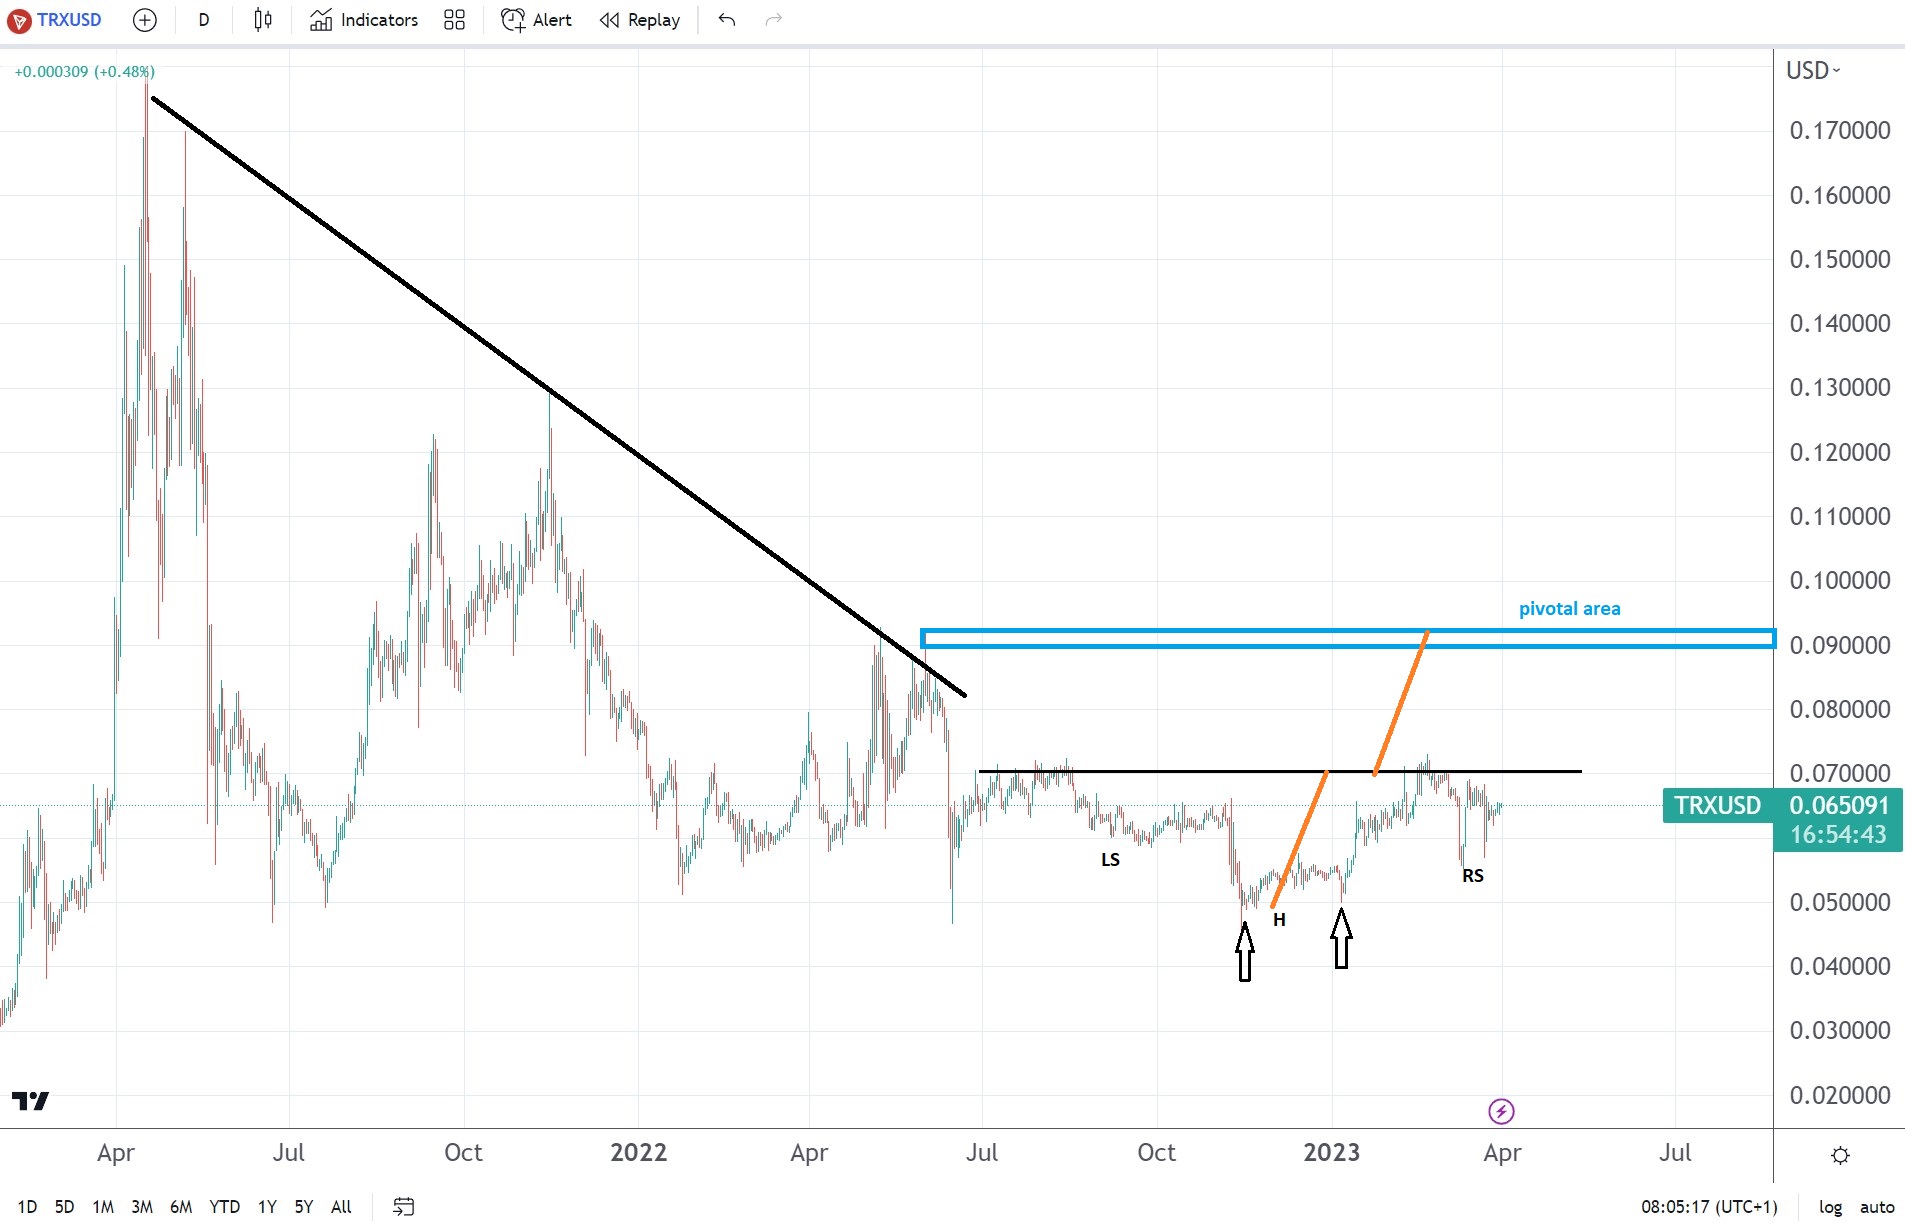
Another bullish setup appeared on the cryptocurrency market, this time involving TRON.TRX/USD struggles to overcome resistance seen at $0.07, and various bullish patterns formed in the meantime.
First, we should mention the bearish trend that lasted until the very last moment of 2022. Even in 2022, the market tried to make a new lower low, but somehow, bulls survived.
Second, even if the future price action confirms the double bottom and the inverse head and shoulders pattern, it would mean nothing if they are not accompanied by further strength above the previous higher low.

TRXUSD chart by TradingView
Tron has formed a double bottom pattern at $0.5
During the last weeks of 2022, Tron has formed a double bottom pattern. As it turned out, the $0.05 area was too difficult to break.
A double bottom is a reversal pattern – a bullish one. Hence, it forms at the end of bearish trends.
Its measured move coincides with the measured move of another bullish pattern – an inverse head and shoulders.
An inverse head and shoulders comes to support the bullish case
An inverse head and shoulders pattern takes more time to form. In this case, it took about half a year and is still incomplete. Bulls may want to see the price action closing above the neckline and then heading toward the measured move seen in orange on the chart above.
Whenever there are more than one patterns that point in the same direction, it is said that the market is in a confluence area. But the real bullish break, if any, would come only if TRX/USD is strong enough to break above $0.09, a pivotal area. On such a move, it means that the previous lower high is broken, and more strength should lie ahead.


Be the first to comment