
 Price Analysis: Will The Increase Continue?")

The Solana (SOL) price has bounced over the past two weeks, validating the $18 horizontal support area.
While the weekly timeframe readings are bearish, the daily timeframe shows several bullish signs, indicating that an eventual breakout is likely.
Solana Price Hovers Above Range Low
The technical analysis from the weekly time frame shows that the SOL price has fallen since its yearly high of $32.13 in July. The decrease culminated with a low of $17.33 on Sept. 11. However, the price bounced afterwards and has increased since (green icon). Similarly to how the decrease validated the $28 area as resistance, the bounce validated the $18 horizontal area as support.
If the Solana price continues the bounce, it can increase by 45% and reach the $28 resistance area. However, if the price falls below the $18 area, it can fall by another 30% and reach the descending resistance line at $14.

The weekly RSI is gradually turning bullish. By using the RSI as a momentum indicator, traders can determine whether a market is overbought or oversold and decide whether to accumulate or sell an asset. If the RSI reading is above 50 and the trend is upward, bulls have an advantage, but if the reading is below 50, the opposite is true. The indicator is attempting to move above 50, a sign of a bullish trend. If this occurs, it will confirm the validity of the increase towards the $28 resistance area.
The co-founder of the Solana network Anatoly Yakovenko made a plea to the US government to boost crypto innovation and not wait for the perfect regulations. It is also worth mentioning that the upcoming FTX asset liquidation will include $1.16 billion in SOL tokens, something that could cause significant sell pressure.
Solana Price Prediction: Breakout Leads Range High?
The daily timeframe technical analysis provides a more devisibely bullish outlook for two reasons.
First, the price bounced at a long-term ascending support line on September 11. The line has been in place since the beginning of the year, measuring the rate of increase since the upward movement began.
Secondly, the price broke out from a descending wedge seven days later. The descending wedge is a bullish pattern which often leads to increases.
Since these bullish signs have occurred at the same time the price bounced at the range low, they make the continuing of the increase more likely.
Finally, the six-hour RSI has broken out from a descending resistance line. Similarly to the weekly RSI, it is in the process of moving above 50. suggests that the bounce will continue. This analysis comes from both the price action and the RSI.
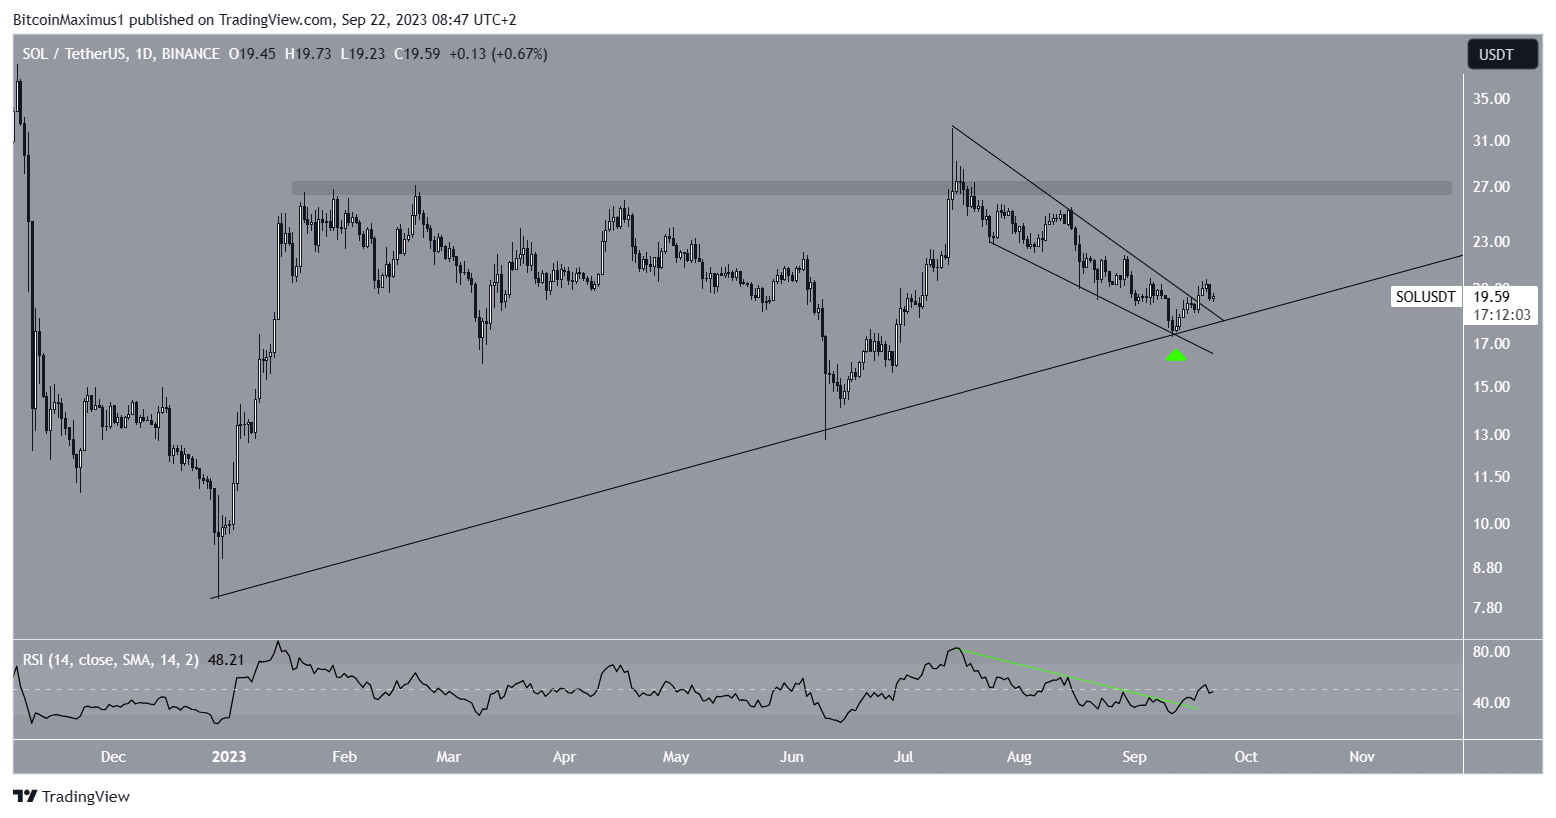
Therefore, the most likely Solana price prediction suggests a 45% increase to the range high is expected. However, a breakdown below $18 could initiate a 30% drop to $13.
For BeInCrypto’s latest crypto market analysis, click here
Disclaimer
In line with the Trust Project guidelines, this price analysis article is for informational purposes only and should not be considered financial or investment advice. BeInCrypto is committed to accurate, unbiased reporting, but market conditions are subject to change without notice. Always conduct your own research and consult with a professional before making any financial decisions.


Be the first to comment